Dana Schwarz · 9 October 2026
Mapping Throughput Variations Across Edge Computing Nodes After Network Topology Changes
Network topology alterations in edge computing environments produce measurable shifts in data throughput across distributed nodes, and researchers continue to track these patterns through systematic monitoring protocols that capture latency spikes alongside bandwidth reallocations. Studies released in October 2026 from multiple academic and governmental sources highlight how rerouting paths after node additions or removals affect packet delivery rates in real time operations.
Core Mechanisms Behind Topology Shifts
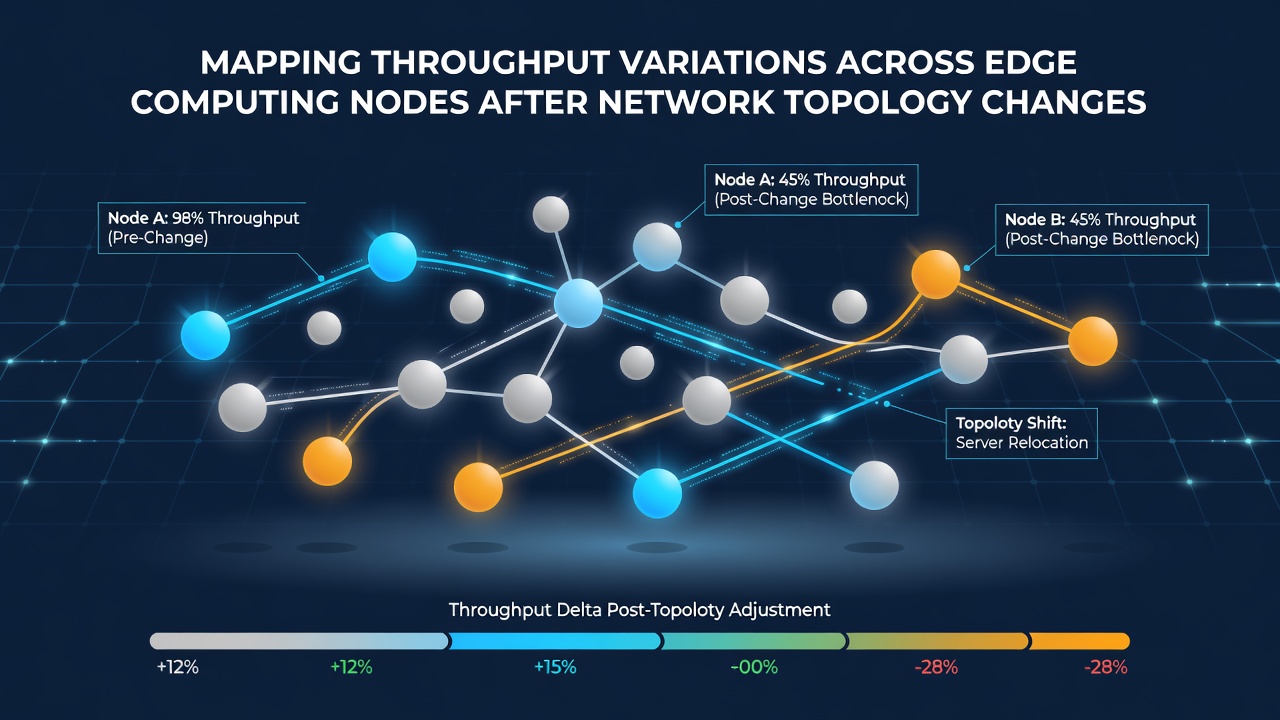
Edge nodes operate at the periphery of larger infrastructures where proximity to end devices reduces transmission delays, yet any reconfiguration of connections between these nodes triggers immediate adjustments in load distribution. Data indicates that when links are added or severed, throughput at individual nodes can fluctuate by percentages ranging from 15 to 40 depending on traffic volume and the specific hardware involved, according to findings compiled by the National Institute of Standards and Technology.
Observers note that dynamic routing protocols respond to these changes by recalculating optimal paths, which in turn redistributes data streams and alters the effective capacity at each point in the network. This process becomes especially pronounced during peak usage periods when multiple nodes experience simultaneous demands that exceed their baseline allocations.
Quantifying Throughput Fluctuations
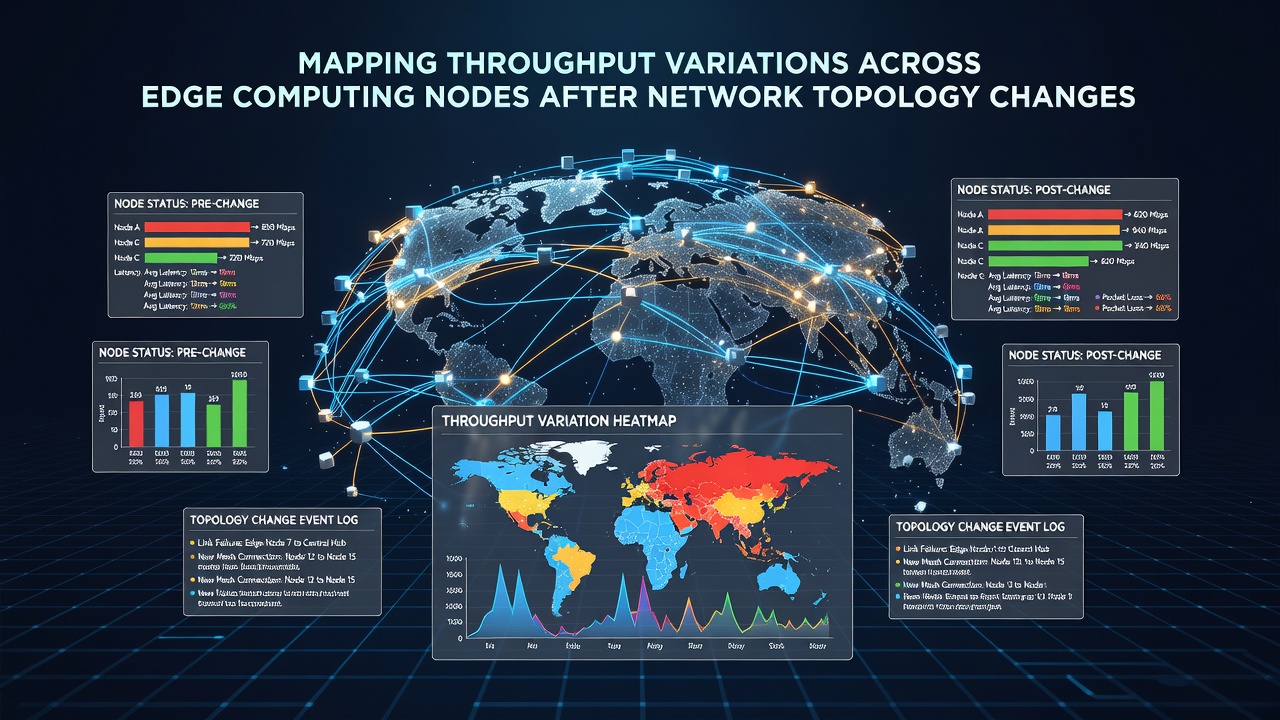
Measurement frameworks rely on continuous sampling of ingress and egress rates at each node to establish baseline values before any topology modification occurs. After changes take effect, comparative analysis reveals deviations that researchers map onto heatmaps or time series graphs for clearer visualization of affected zones. One study from Canadian research institutions demonstrated that certain peripheral nodes lost up to 28 percent of prior throughput following a central hub failure while others gained compensatory capacity through alternate routes.
Analytical Approaches and Tools
Software suites designed for network telemetry collect granular metrics including jitter, packet loss ratios, and sustained transfer speeds that allow engineers to isolate the precise impact of each topology event. These tools integrate with existing monitoring platforms so that variations appear in context rather than as isolated anomalies, and analysts can correlate them with external factors such as concurrent software updates or hardware maintenance schedules. Evidence from collaborative projects involving European research consortia shows that combining machine learning models with traditional statistical methods improves prediction accuracy for future fluctuations once initial patterns are established.
Geographic distribution plays a notable role because nodes located in dense urban clusters exhibit different recovery curves compared with those in sparse rural deployments where fewer redundant paths exist. Reports compiled by the Commonwealth Scientific and Industrial Research Organisation in Australia document how coastal installations recovered throughput more rapidly after link restorations than inland counterparts due to denser fiber interconnectivity in metropolitan zones.
Practical Applications in Operational Settings
Operators apply mapping results to refine load balancing algorithms that anticipate topology driven changes and preemptively shift traffic volumes before performance degrades noticeably. This proactive stance relies on historical datasets that capture similar events across comparable network scales, enabling more accurate forecasting models. In practice, teams review logs from October 2026 deployments to validate whether predicted variations matched observed outcomes and adjust parameters accordingly for subsequent interventions.
Integration with broader infrastructure management systems allows throughput maps to feed directly into capacity planning cycles, ensuring that hardware upgrades align with documented demand shifts rather than static estimates. Those who maintain large scale edge deployments report that regular mapping exercises reduce unplanned downtime incidents by highlighting vulnerable nodes early in the reconfiguration process.
Conclusion
Systematic mapping of throughput variations provides essential visibility into how network topology changes propagate through edge computing infrastructures, and continued refinement of measurement techniques supports more resilient designs. Data gathered across diverse regions continues to inform best practices that balance performance consistency with the flexibility required for evolving connectivity demands.